Most analysis work is a relay between tools. You open a file in one place, clean it in another, run the test in a third, and paste numbers into a document by hand. CodeSplash Analytics keeps that whole route in one Mac app: import a file, profile it, clean it, test it, model it, and report on it, with the Python and R code for every step there to read. Version 0.9.2 is available now from analytics.codesplash.ai, with a 30-day free trial and no card.
From file to finding
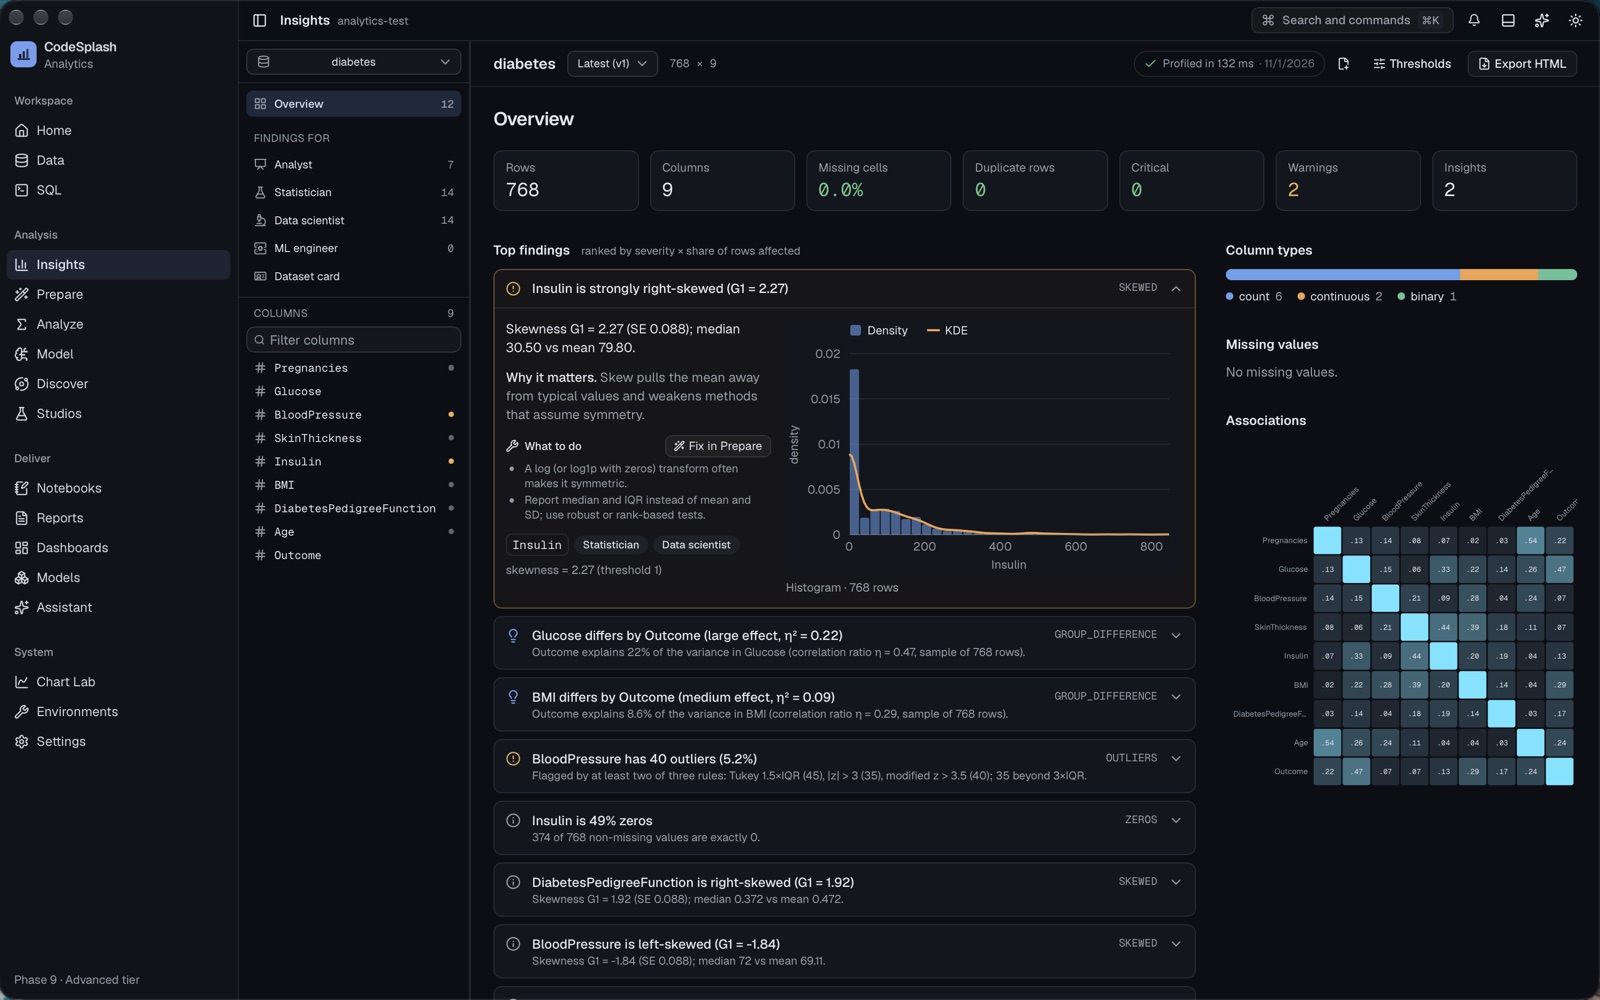
Open a CSV, Excel, Parquet, JSON, SPSS, Stata, or SAS file, or connect to Postgres, MySQL, SQLite, DuckDB, or S3. Insights profiles the data straight away and ranks what needs attention: skewed columns, outliers, zero-heavy columns, groups that differ. Each finding says why it matters and what to do about it.
Prepare turns those fixes into steps you can read. Every step shows the rows it changed, and every step compiles to DuckDB SQL, pandas, and dplyr, so your cleaning is code rather than a memory of clicks.
Results that explain themselves
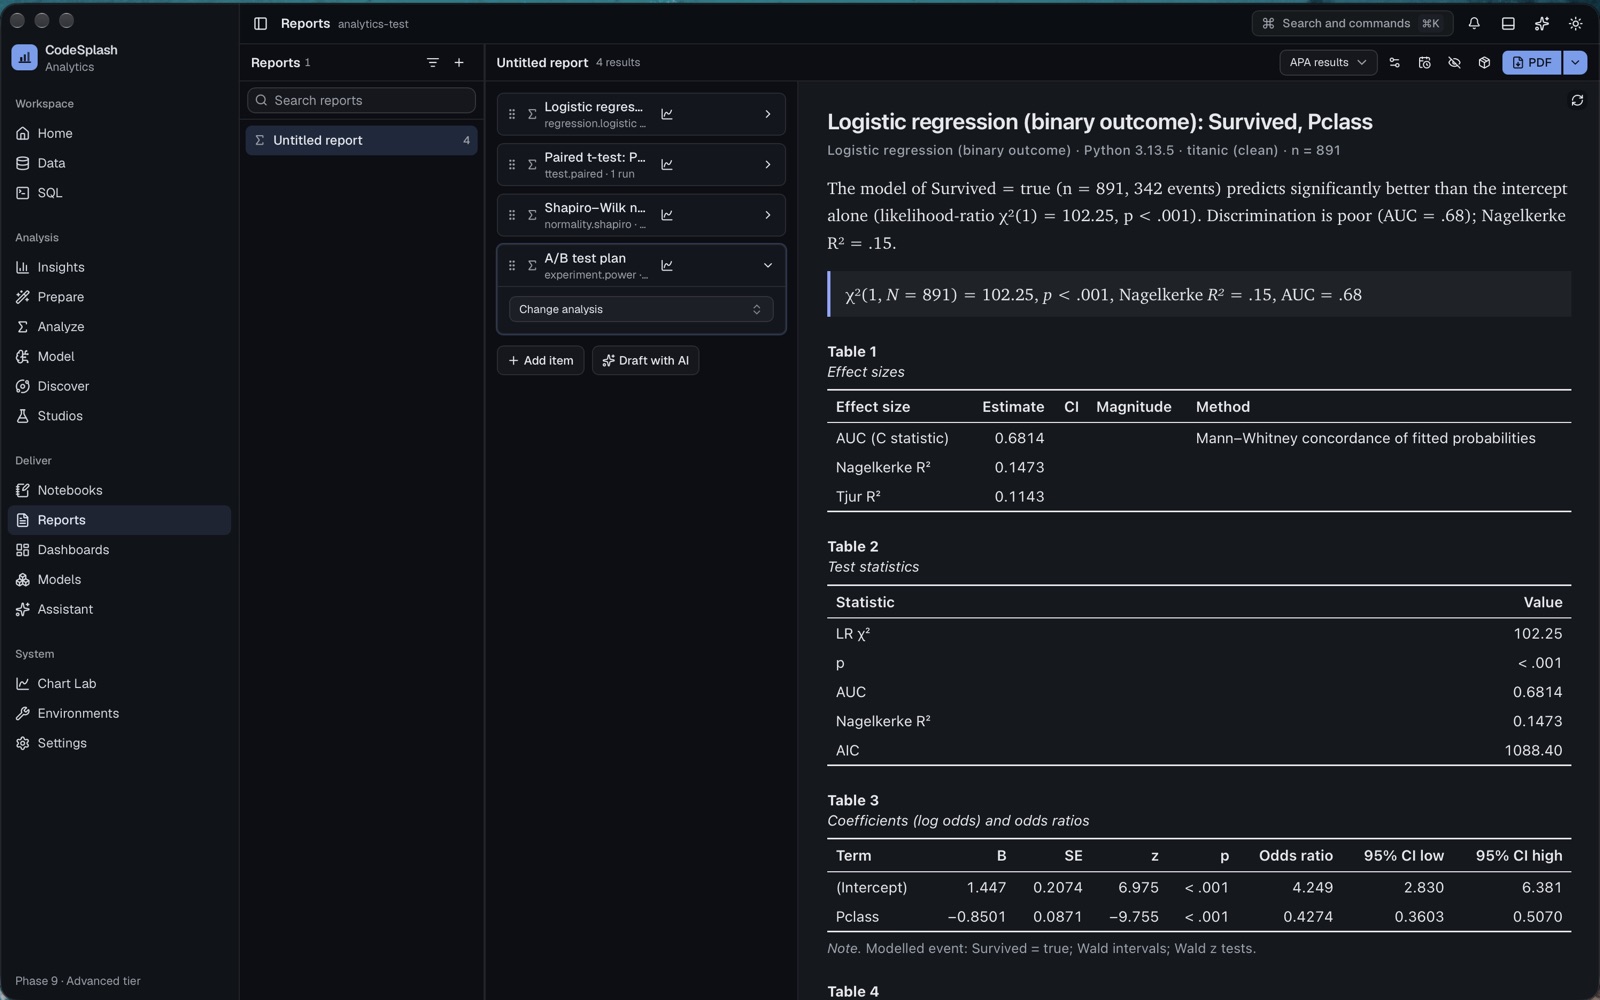
Analyze has 286 methods. If you aren't sure which one fits, a test chooser asks a few questions and a decision tree maps the options. Each result card carries its effect sizes, its assumption checks with suggested remedies, and a write-up in APA style generated from the numbers. Open the Code tab and the exact script is there.
Python and R, checked against each other
284 of the 286 methods run in both Python and R. You can run a result in one engine and verify it in the other on the same specification. In the test suite, 1,488 of 1,488 parity cases agree within their declared tolerance, and 30 NIST reference datasets pass. When the engines differ, they differ inside a declared band, and each result shows its parity tier.
The same idea carries into machine learning. Model sets up experiments on shared folds, so Python and R models are scored on the same data. You get tuning, a leaderboard, explanations, forecasting, and a model registry with drift checks and exports.
Work you can rerun without the app
A project is a folder on your Mac. When you want to hand your work to someone, export an analysis package: the Python and R scripts with pinned environments, the SQL, Quarto and R Markdown documents, a Parquet snapshot of the data, and the results the app saved. A verify.py script reruns everything and compares each result with the saved one. It needs Python, not CodeSplash.
That matters to me. If you stop paying, the scripts you exported keep running.
Charts, reports, and dashboards
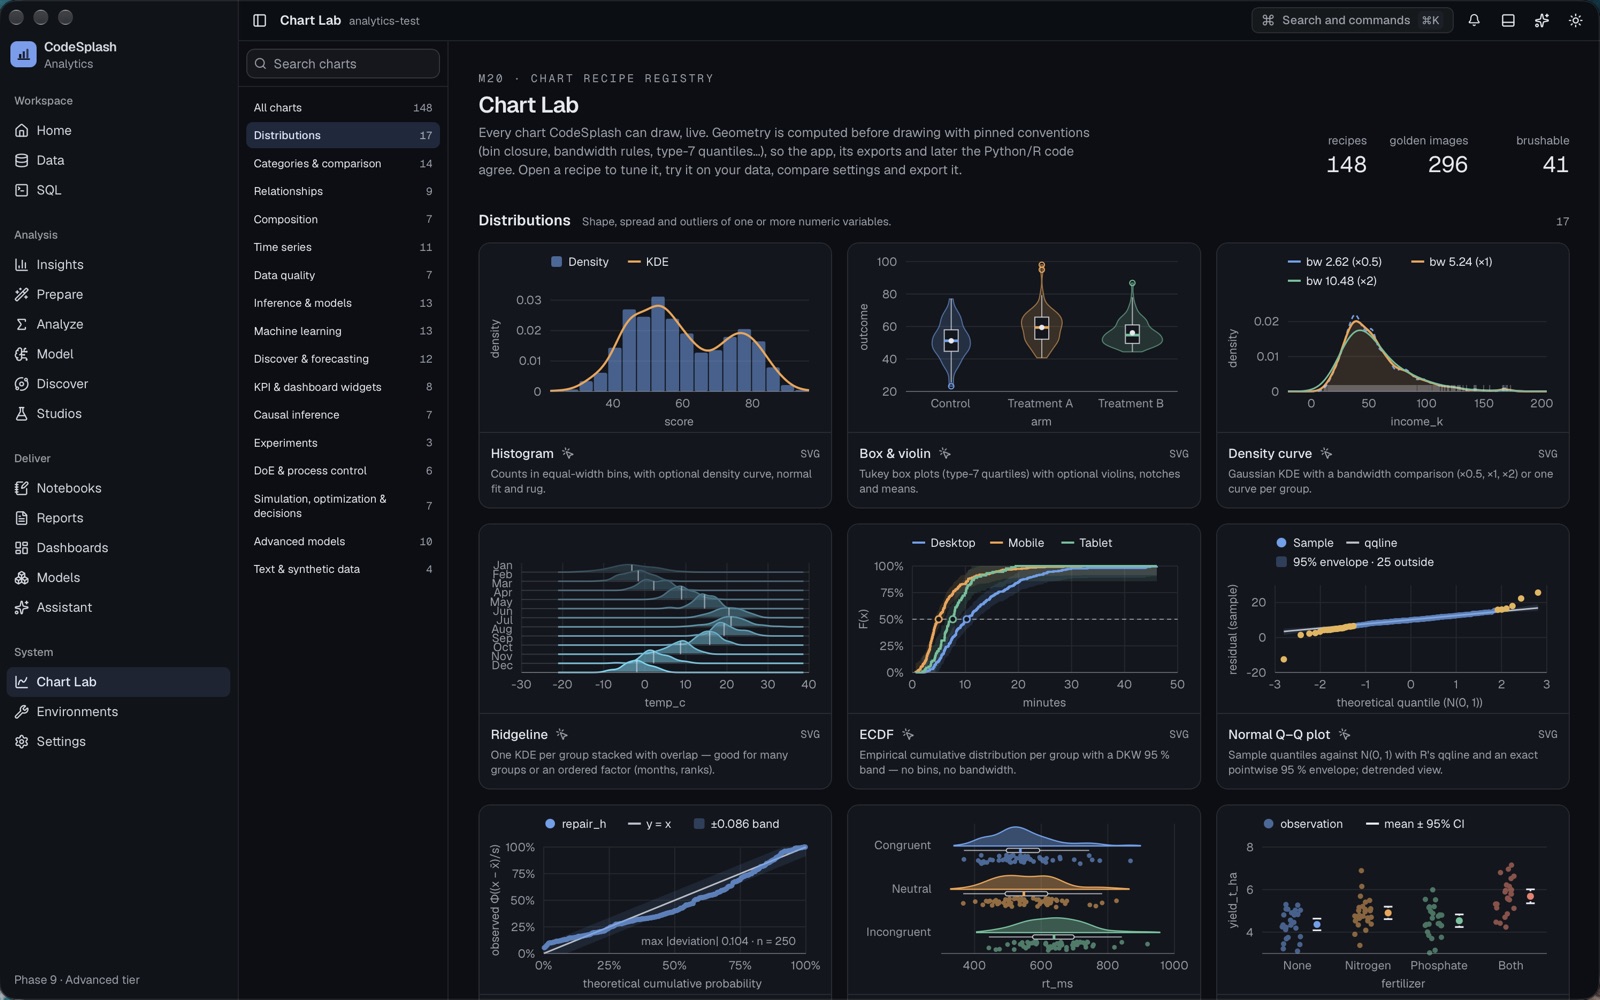
Chart Lab holds 293 chart recipes in 21 families, each one live and exportable as Python or R. Reports export to HTML, PDF, Word, or PowerPoint. Dashboards export as files or as runnable Shiny, Streamlit, and Dash apps.
AI on your terms
AI is optional. Bring your own keys for Anthropic, OpenAI, Google Gemini, or xAI, or run local models through Ollama or LM Studio. By default AI features see metadata, not rows, and you can preview what will be sent before a request goes out. Set budgets per request, per day, and per month.
Learn as you go
The Academy is built in: 518 lessons, 4,719 quiz items, and a guide page for every test with its assumptions, its formula, how to read the output, and checked Python and R code. Walkthroughs point at the real controls and move on when you do the step.
Availability and pricing
CodeSplash Analytics runs on Macs with Apple Silicon and macOS 14 or later. Download it, confirm your email, and the full product is yours for 30 days.
After the trial it is $199 a month or $1,990 a year. The first 200 customers pay $149 a month or $1,490 a year and keep that price while their subscription stays active. A license covers three Macs. Windows and Linux are planned, with a waitlist open now.
The docs cover setup, every part of the app, and troubleshooting. Questions and bug reports go to support@codesplash.ai or the CodeSplash Discord.