
Documentation
CodeSplash Analytics
Install CodeSplash Analytics on your Mac, bring in a dataset, and take it from profile to tested result, model, and report, with the Python and R code for every step.
Get started#
What you need#
A Mac with Apple Silicon (M1 or later) on macOS 14 or later. Intel Macs aren't supported. Windows and Linux are planned, and you can join the waitlist at analytics.codesplash.ai.
Install#
- Download the app. No email is needed to download.
- Open
codesplash-analytics-macos-arm64.dmgfrom your Downloads folder. - Drag CodeSplash Analytics to Applications, then open it from there.
The app is signed and notarized by Apple. To check a download, compare it with the published SHA256SUMS:
shasum -a 256 ~/Downloads/codesplash-analytics-macos-arm64.dmgStart your trial#
The first time you open the app, it asks for your email and sends a 6-digit code. The code expires in 10 minutes. Enter it and your 30-day trial begins, with no card. This step needs a connection. After that, your trial works offline to its end date.
The setup guide#
A short guide walks through your goal, Python and R, AI, where to start, a first result, and your level. You can skip any step, and Home keeps a "Get set up" card until you finish. To learn before you open your own data, start the Academy, which has a practice project of its own.
Set up Python and R#
Guided install#
You don't need Python or R installed. Guided setup installs them with your consent, including the packages the app uses. Downloading them needs a connection.
The Environments page#
Environments shows each engine's status, its packages, and anything that went wrong. You can use the app-managed Python or point it at your own environments. Pandoc, Quarto, and a portable R install are added on demand when a feature needs them.
Bring in your data#
Projects#
A project is a folder on your computer. Create one, then import files, a whole folder, or pasted cells. You land on the Data page.
File types and connections#
Import CSV and TSV, Excel, Parquet, JSON, and SPSS, Stata, or SAS files. Connect to Postgres, MySQL, SQLite, DuckDB, or S3. Connection secrets are kept in your Mac's Keychain.
Versions and the grid#
Every dataset version is a snapshot you can compare with another. The grid shows a histogram in each column header and has faceted filters. The SQL page (⌘3) runs DuckDB queries with history, parameters, and saved queries.
Read Insights#
The profile#
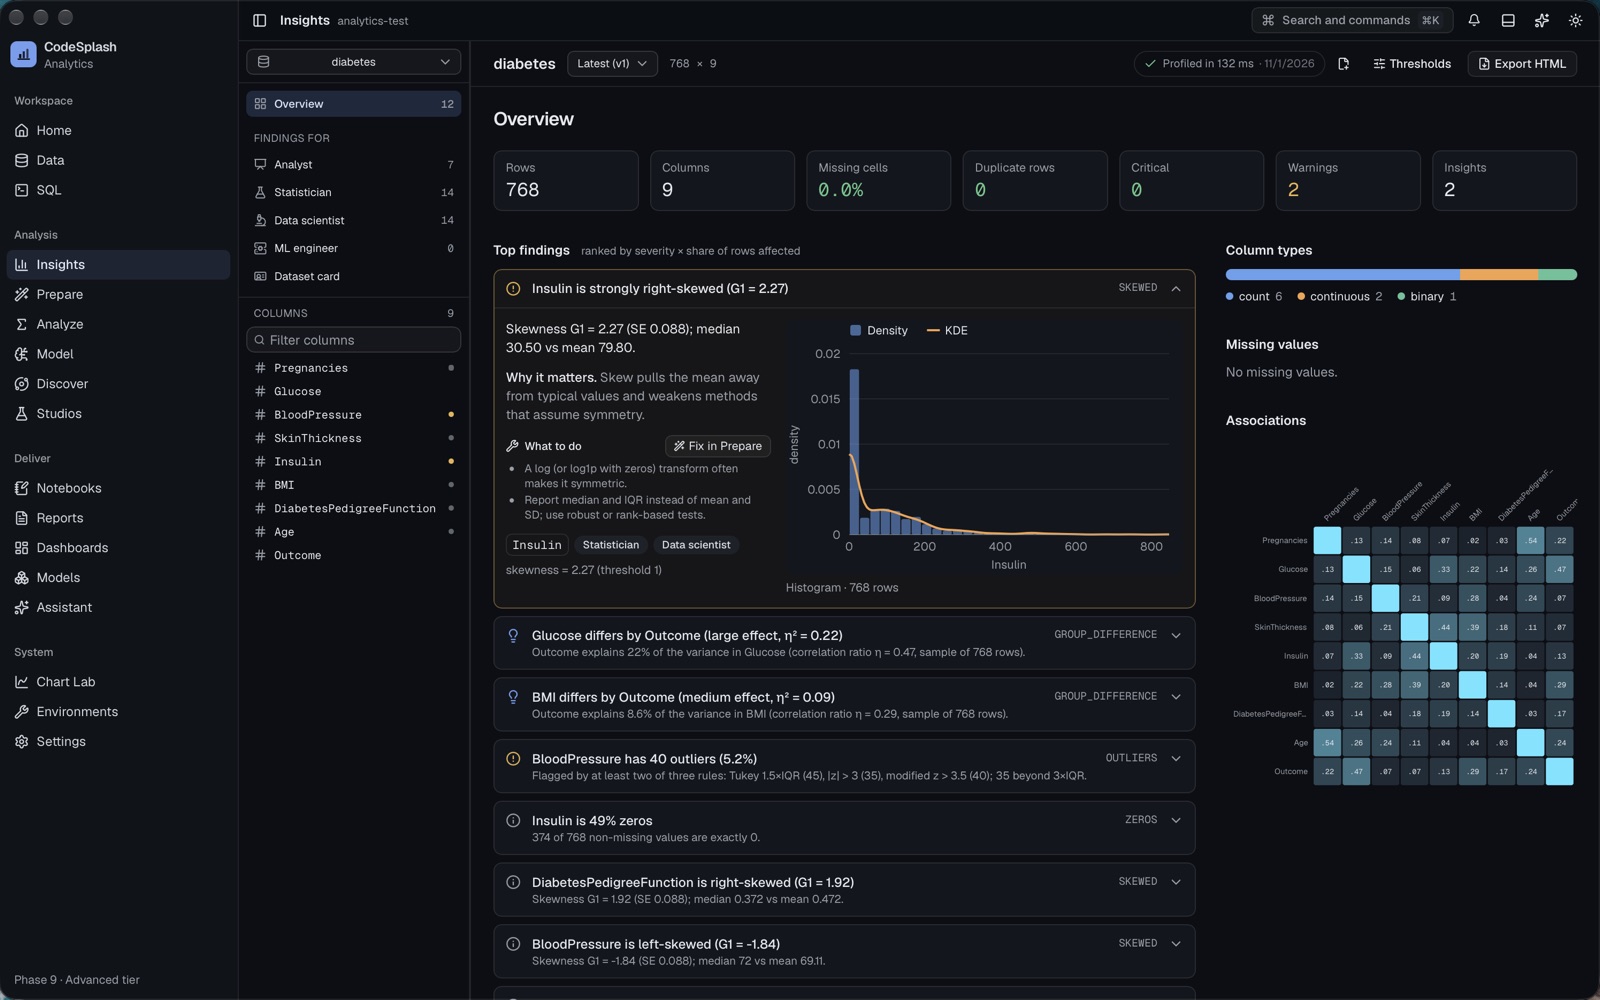
Insights (⌘4) profiles a dataset as soon as you open it. Top findings are ranked by severity and by how many rows they affect, and each one says why it matters and what to do.
Views for each role#
Filter findings for an analyst, statistician, data scientist, or ML engineer. The dataset card summarizes the data in one page you can export.
Fix in Prepare#
Many findings have a Fix in Prepare button that takes you to Prepare with a suggested step for that problem.
Prepare your data#
Steps and recipes#
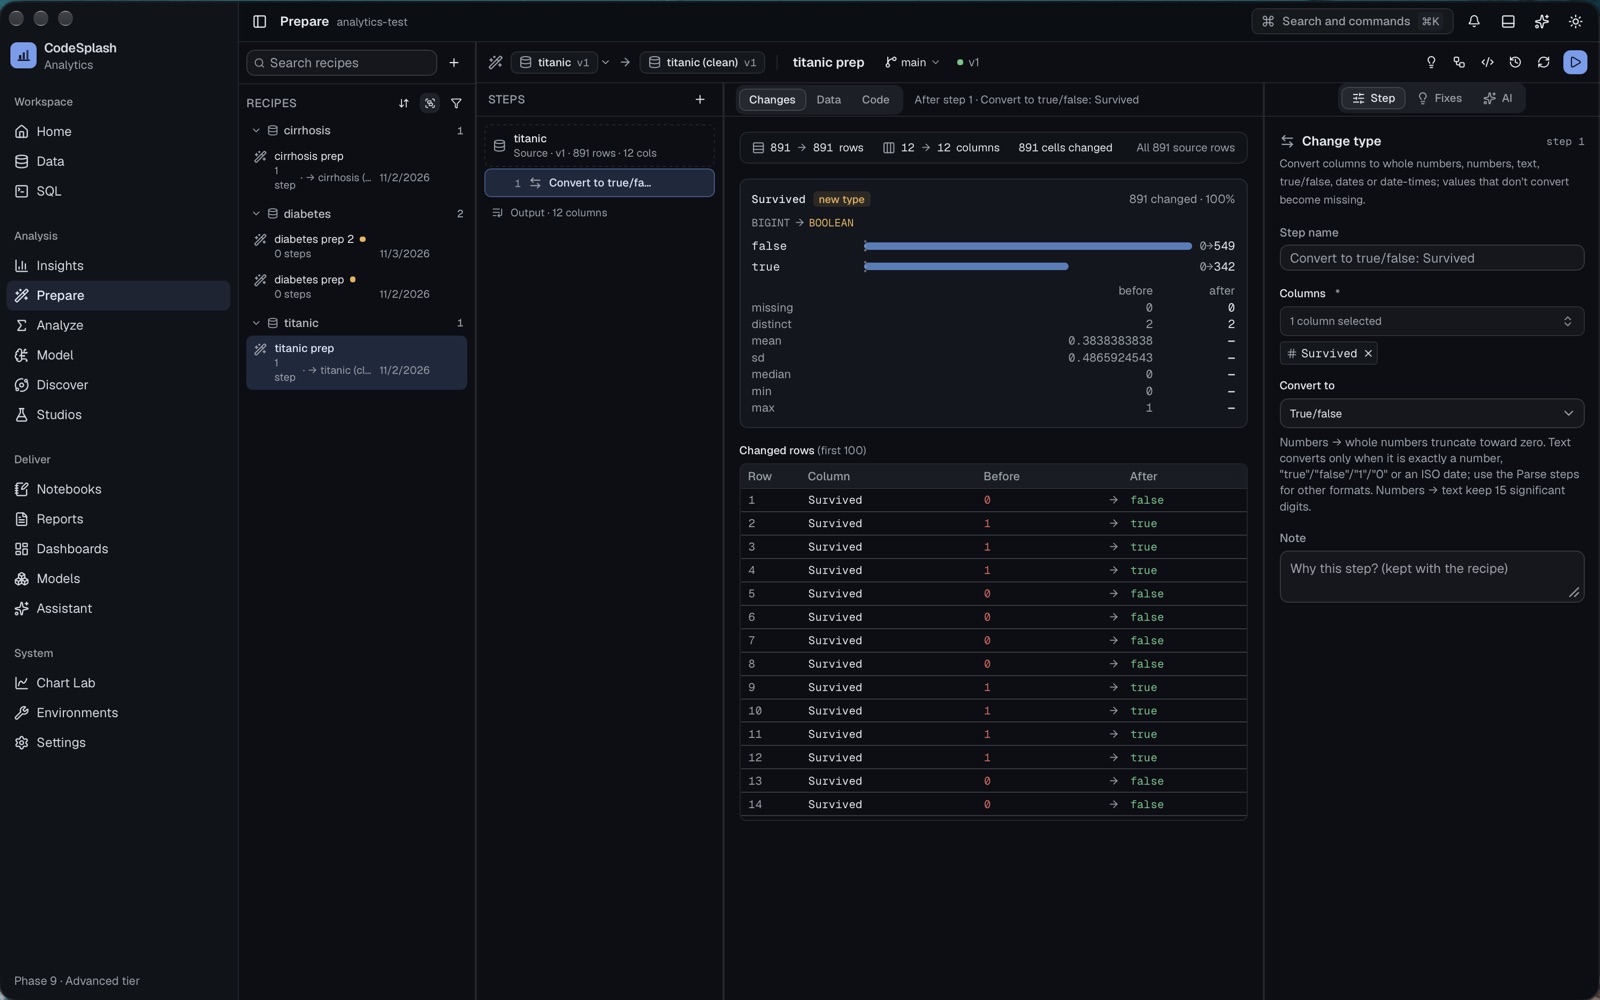
Prepare (⌘7) builds a recipe from steps such as type changes, missing values, reshaping, and feature engineering. Each step shows before and after summaries and every changed row.
Code for every step#
Each step compiles to DuckDB SQL, pandas, and dplyr, so the cleaning you did in the app is code you can read and run elsewhere. Recipes have versions and branches, and the output is saved as a new dataset version.
Run an analysis#
Choose a method#
Analyze (⌘5) holds 286 methods. If you aren't sure which one fits, use Choose a test for a short set of questions or the Navigator for a decision tree. A multiple-testing ledger keeps track of how many tests you have run.
Read the result card#
Each result shows its effect sizes, assumption checks with suggested remedies, and a write-up in APA style generated from the numbers. The Code tab shows the exact Python or R that produced it.
Check one engine against the other#
284 of 286 methods run in both Python and R. Verify in R (or in Python) runs the same specification in the other engine and compares the results at the method's declared tolerance. Across the test suite, 1,488 of 1,488 parity cases are within tolerance.
Studios#
Studios cover causal inference, experiments (power, CUPED, sequential tests), quality and designed experiments, scenarios and optimization, fairness, synthetic data, meta-analysis, spatial analysis, and time series.
Build and register models#
Experiments#
Model sets up an experiment with a split designer, so Python and R train on the same folds and scores can be compared fairly. Learners include elastic net, random forests, XGBoost, LightGBM, CatBoost, SVM, and MLP.
Tuning and the leaderboard#
Tune with grid, random, Sobol, or TPE search, or let AutoML try a set of learners with dials for accuracy, time, and interpretability. The leaderboard compares runs, and each run has evaluation, explanation, fairness, and robustness tabs.
Forecasting and Discover#
The Forecast studio handles time series. Discover finds clusters, anomalies, association rules, and topics, and saves segments back to your data.
The model registry#
Register a model to give it versions and stages. From the registry you can score new data, check for drift, and export to ONNX, MLflow, Python, R, or SQL.
Charts, dashboards, and notebooks#
Chart Lab#
Chart Lab holds 293 chart recipes in 21 families. Open one to tune it, try it on your data, and export its Python or R code.
Dashboards#
Build dashboards by dragging and resizing widgets, with filters and cross-filtering between them. Present them full screen, export to HTML, PDF, or PNG, or export a runnable Shiny, Streamlit, Dash, or Quarto app.
Notebooks and scripts#
Notebooks (⌘6) supports Python, R, and SQL notebooks, scripts with a console, and Quarto or R Markdown documents. SQL cells run against the project warehouse and hand their result to Python or R.
Report and export#
Reports#
The report builder starts from a template and collects analyses, charts, tables, and models. Export to HTML, PDF, Word, PowerPoint, ODT, or Markdown, or as Quarto or R Markdown source.
Analysis packages#
An analysis package is a ZIP you can hand to anyone. It holds the Python and R scripts with pinned environments, the SQL, Quarto and R Markdown documents, a Parquet snapshot of the data, each analysis's settings and saved result, the helper packages, and a README. Run the included check without the app:
python3 verify.pyIt checks every file against its SHA-256, reruns each analysis, and compares each result with the one the app saved. Exit status 0 means everything reproduced.
The code is yours#
Generated code belongs to you, including in products you sell. See the terms for the details on the open-source helper packages.
Use AI on your terms#
Providers and local models#
AI is optional, and everything else in the app works without it. Under Settings, AI, add your own keys for Anthropic, OpenAI, Google Gemini, xAI, or any OpenAI-compatible endpoint. Keys are kept in your Mac's Keychain. Ollama and LM Studio run local models with no key and no bill.
Privacy modes#
Choose what AI features can see: Metadata only (the default: schemas, labels, aggregates, and results, with no rows), Allow samples, Allow full data, or Local models only. Before a request goes out, you can see what will be sent.
Budgets and Agent mode#
Set spending limits per request, per day, per month, and per agent run, and see what each call cost. Your provider bills you directly. The Assistant (⇧⌘A) chats about your project, and Agent mode plans a task, waits for your approval, then runs and verifies each step.
MCP server#
Turn on the MCP server in Settings to let Claude Desktop, Claude Code, and other MCP clients read your datasets and results. It listens on your Mac alone and requires a token.
Learn with the Academy#
Lessons and guide pages#
The Academy (⌘8) has 518 lessons and 4,719 quiz items, grouped in tracks. Every test in the statistics guide has a page with the question it answers, its assumptions, the formula, how to read the output, pitfalls, and checked Python and R code.
Walkthroughs and Explain mode#
Walkthroughs point at the real controls and move on when you do the step, with hints when you're stuck. On any result card, Explain mode describes what each number means.
Trial, license, and billing#
Pricing#
After the 30-day trial, CodeSplash Analytics is $199 a month or $1,990 a year. The first 200 customers pay a launch price of $149 a month or $1,490 a year and keep it while their subscription stays active. Current prices are on the pricing section.
Activate a license#
Buy from the website or from the app. Your license key arrives by email and looks like CSAN-XXXX-XXXX-XXXX-XXXX. In the app, choose I have a license key and paste it. A license needs a check-in at least every 30 days, and the app checks in at most once a day.
Three Macs#
Each license covers up to three devices at a time. To move to a new Mac, remove a device in the app with your license key.
Cancel and refunds#
Manage or cancel your subscription in the billing portal, opened from the app. The app keeps working to the end of the period you paid for. See the refund policy and the license guide.
When a trial or license ends#
The app locks and nothing is deleted. Your projects stay on your computer, and the scripts and packages you exported keep working without the app.
Updates and support#
Updates#
The app checks GitHub for signed updates and shows what's new after each one. Release notes are also on the CodeSplash updates page.
Report a problem#
Choose Help, Report a Problem. The app puts the report together for you to review, then you send it by email or as a GitHub issue. Issues are public, so leave out your data and keys.
Contact#
Email support@codesplash.ai, or ask in the CodeSplash Discord.
Troubleshooting#
macOS won't open the app#
Open it from Applications, not from the disk image, and choose Open when macOS asks. If macOS says the app is damaged, download it again and compare the checksum on the download page. Please don't turn Gatekeeper off.
The code email doesn't arrive#
Codes can take a minute, and you can ask for another after 30 seconds. Check spam and search for noreply@codesplash.ai. Temporary email addresses can't start a trial.
Python or R setup failed#
Setup needs a connection, and a VPN or network filter can block it. Open Environments to see what went wrong and run setup again. Importing data and running SQL keep working in the meantime.
The app can't reach the server#
A VPN or network filter may be blocking api.analytics.codesplash.ai. Allow that address or try another network, then choose Check again. An active trial or license keeps working while you sort it out.
The app says your clock looks wrong#
Set the date and time automatically in System Settings, then choose Check again. Nothing is deleted.
More fixes are in the troubleshooting guide.
Frequently asked questions#
Which Macs does it run on?#
Macs with Apple Silicon on macOS 14 or later. Intel Macs aren't supported.
Do I need to give an email to download?#
No. Downloads are direct. The app asks for your email when you start the trial.
Does my data leave my Mac?#
Not to CodeSplash. The app contacts CodeSplash for your trial and license, and GitHub to check for updates. AI features send data only to providers you configure. The full policy is at analytics.codesplash.ai/privacy.
Do Python and R give the same answers?#
1,488 of 1,488 parity cases are within their declared tolerance. Some results differ inside that band, and 284 of 286 methods run in both engines.
Can I use the code it generates?#
Yes. It's yours, including in products you sell.
Why pay when R and Python are free?#
You get the whole route from raw file to checked result in one place, with both engines already compared and results that explain themselves. You keep the exact scripts, and they keep running if you stop paying.